Strategic business decision making can be rather difficult without a clear insight into the performance of a business day-to-day; this is where data comes in. Having tools that allow business owners to access insightful information about performance, customer trends or productivity can be a game-changer when it comes to planning for the coming years. The most successful business leaders are forward-thinking and planning for the future and longevity of the business without using ‘guess-work’; instead, utilising powerful analytic tools that work off real data to create more accurate predictions. In present times, market trends can shift almost overnight, therefore, creating conventional forecasts based on historical financial data is no longer good enough and the utilisation of data can often be the difference between being the front runner in the industry and being last to the post. At 4PointZero, we aim to help businesses answer those all-important business questions which can help you strive in the industry. Below are 3 examples where data can help your business strategise effectively:
Key Performance Indicators and Dashboards
The use of financial dashboards and KPI reports can be a useful tool for appraising performance as well as identifying points for improvement. As no two businesses are the same, it is important to consider the type of metrics a business would find useful and build a dashboard that works on this basis rather than using a standard off-the-shelf solution. This type of reporting can be driven off real-time financial data from a number of sources to produce multiple key performance metrics, displayed in an easy-to-interpret online web application. So how do some businesses use these metrics?
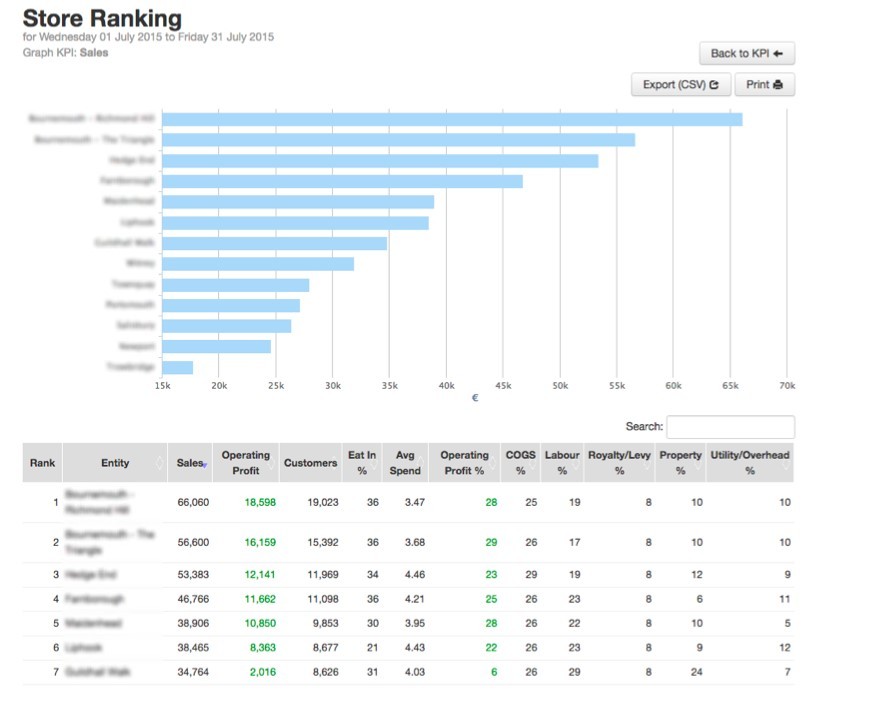
A number of Hospitality businesses are making use of the vast amount of data collected by their operational systems. For example, a restaurant chain may have multiple sites located around the country which are all connected to a centralised analytics tool which drives the dashboards. Each store/branch will be responsible for their own results and are able to access their own localised performance metrics. This allows each unit to review, manage and assess their own KPIs, empowering store managers and driving a culture of data-driven strategizing. It also allows head office workers to review and compare store performances and promote some healthy competition by ranking performance between different stores on a quarterly, monthly or even weekly basis – this results in better employee engagement and motivation.
Detailed Sales Analytics
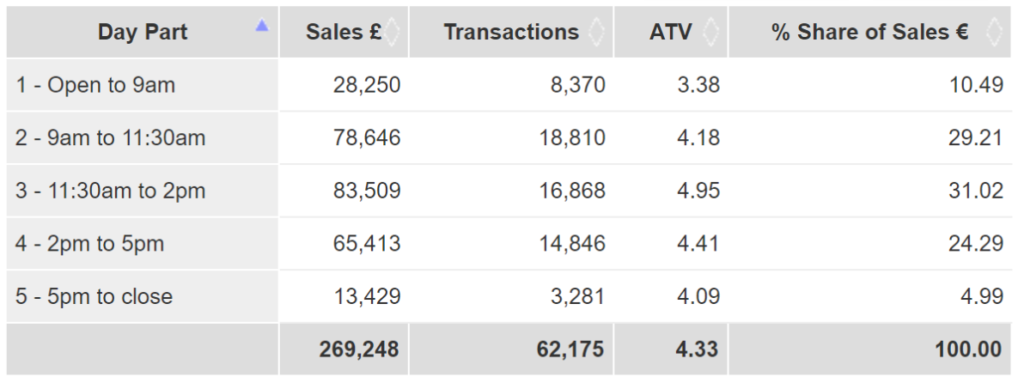
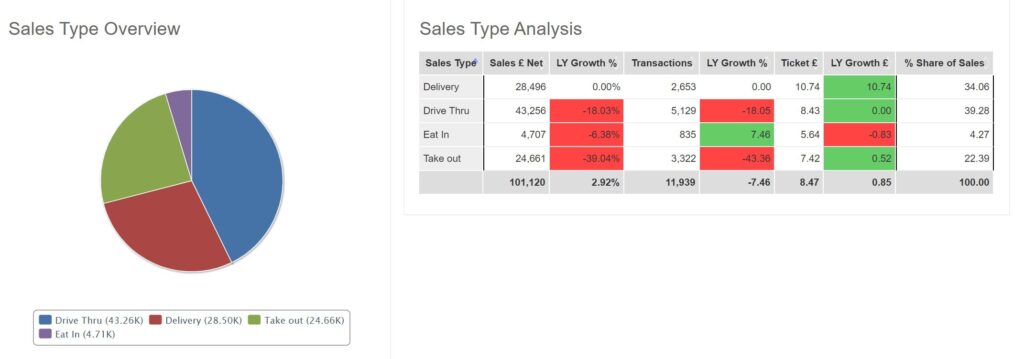
As with any business, in order to be profitable, you need to know what your customer wants – this can sometimes be unpredictable and with the ever-increasing volatility of market demands, it is hard to keep up with the newest trends. Data analytics aims to make the prediction of customer buying habits more reliable and accurate. Being able to review real-time graphs and statistics built from a point of sales system or something similar, provides answers for some key questions, such as:
- What is the average spend of my customers?
- What product is the most popular?
- What product segment had the biggest turnover this year/month/week/hour?
- Which of my sales channels bring in the most revenue?
- How do these sales trends compare to last year – should we shift our marketing strategy?
With the above questions being answered, it enables better decisions to be made that can help drive a better business performance or save on costs. For example, by identifying the most popular product and predicting demand, it allows for better stock management. Perhaps it also allows you to predict seasonal fluctuations in your sales and therefore, helps you to pre-empt a marketing strategy to help reduce the effects of the quieter months. It also allows you to have more confidence in which of your sales channels to invest in – for example, you may find that consumers are more likely to order your product online rather than purchase in-store, hence opening up a new site would not provide you with any benefit.
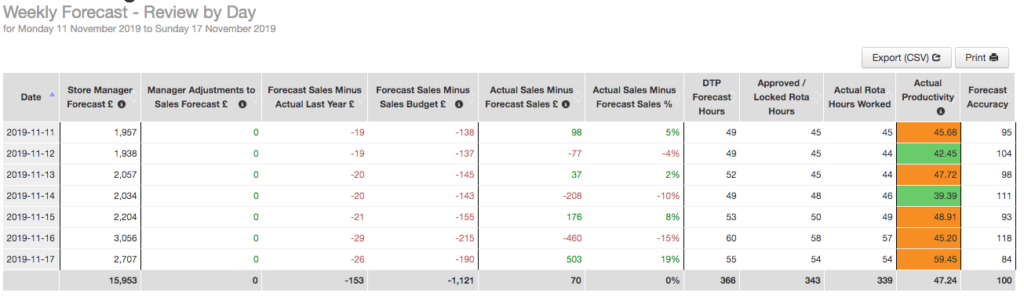
Tracking Resources and Rota Management
Being able to monitor and track what resources you need in your business can cut costs and prevent being over or under-staffed. Intelligent predictive technologies can assist with managing staff and producing staff rotas. Simple analytics such as knowing what days in the week are your busiest and what part of the day requires more staff are obviously a good place to start but with even more in-depth predictive information available resourcing staff has become a lot more intelligent. An example would be a predictive tool that uses information to accurately predict how many staff members will be required on a particular day and even for a particular hour in the day. Point of sales information can be used to produce reports on the productivity of each staff member or team based on the sales made within their shift; even going into as much granular detail as which member of the team sold the most products. This also ties in with staff appraisals as you have full visibility of which staff members have sold the most product and which particular products they have sold; for example, one of your staff members may have up-sold more products throughout their shift than others. This can lead to staff engagement and motivation as they know that their hard work is visible and perhaps may even be rewarded.

Above are several examples where data-driven strategizing can help with pushing your business to new heights. Our role at 4PointZero is to understand your business and provide a accounting solution that allows you to utilise the vast amount of data that is available in your business. Using a combination of cutting-edge analytics/reporting systems, it is easy to leverage the power and insights from data and use this to make those critical business decisions.
If you would like to know more about how you can achieve this please do not hesitate to contact us at https://4pointzero.co.uk/
Frequently Asked Questions (FAQ)
What are the key benefits of data-driven decision making?
Data-driven decision making offers several significant benefits. It empowers businesses to make informed choices based on concrete evidence rather than intuition. This approach enhances accuracy, minimizes risks, and improves overall operational efficiency. By analyzing data, organizations can identify trends, customer preferences, and market opportunities, leading to better strategies and outcomes.
How does data-driven decision making impact business growth?
Data-driven decision making plays a pivotal role in business growth. It enables companies to understand customer behaviors, preferences, and pain points. By leveraging this information, businesses can tailor their products and services to meet specific demands, resulting in higher customer satisfaction and loyalty. Moreover, data-driven insights aid in identifying new market segments and expansion opportunities, fostering overall business growth.
In what ways does data-driven decision making contribute to risk reduction?
Data-driven decision making provides a structured approach to risk reduction. By analyzing historical and real-time data, businesses can anticipate potential risks and take preventive measures. This proactive strategy allows organizations to identify operational inefficiencies, market fluctuations, or potential failures in advance, enabling them to mitigate risks and ensure smoother operations.
What role does data-driven decision making play in optimizing operational processes?
Data-driven decision making optimizes operational processes by identifying inefficiencies and bottlenecks. Through data analysis, businesses can pinpoint areas that need improvement, streamline workflows, and allocate resources more effectively. This leads to enhanced productivity, reduced operational costs, and improved overall efficiency.
How does data-driven decision making impact resource allocation?
Data-driven decision making improves resource allocation by identifying where resources are most needed and where they can yield the highest returns. By analyzing data on project performance and resource utilization, businesses can allocate budgets, personnel, and time more efficiently, leading to improved project outcomes and reduced waste.