KPI monitoring and reporting using interactive dashboards and reports is very useful for businesses globally, but also remains a real business problem for many global firms. At 4PointZero we are driven towards solving real business problems that will add value to any organisation. As this is quite a wide-ranging business mission it requires us to be extremely flexible both in the way that we work and with the tools that we implement. We have conducted years of research into how certain systems work and communicate to ensure we have the best tools to deliver an effective solution that will stand the test of time at an extremely competitive price point.
Our belief is that many businesses feel that implementing automation tools for business analysis or having dashboards and KPI tracking and reporting is an expensive process and therefore only accessible to large corporates, but that is simply not the case. Also, many businesses feel they need to hire an internal Data Analyst which again is expensive and not necessary, as you end up paying for both the tool and a salary, with very little knowledge of what your analyst is adding to your business. At 4PointZero, we provide KPI Monitoring and Reporting tools which can perform the role of an in-house Data Analyst and you can get real time KPI data analytics at far less expense than a salaried skilled employee.
The main challenge for most businesses is finding a secure and automated way to collect data on a regular basis. This would preferably be daily as a minimum but could even be as often as every ½ hour or hour. We have various methods which we can employ to achieve this and are able to have technical conversations directly with the system providers so they can understand our requirements. Once this is achieved, we have the tools to ensure accuracy in KPI reports in as simple or as complex way as required to present, so that you get meaningful data. As we are also all financially qualified professionals, we can also employ a little artistic license based on our in-depth understanding of business issues to go beyond the instructed requirement if we feel this would be beneficial to the client.
Overall, we tend to cover 4 different core types of KPI monitoring and reporting needs:
1. Operational reports:
These reports can be shown graphically via 3 different options:
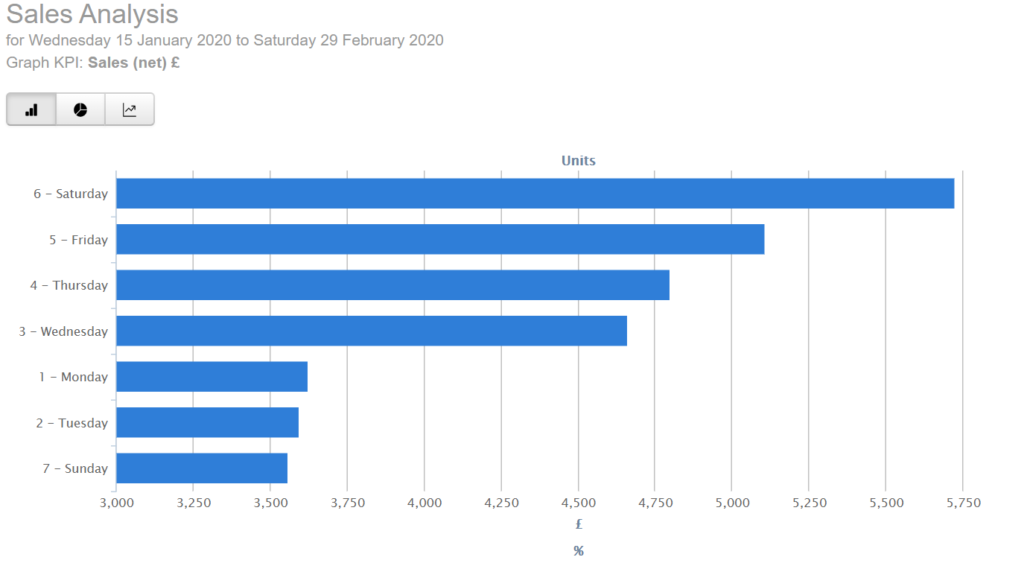
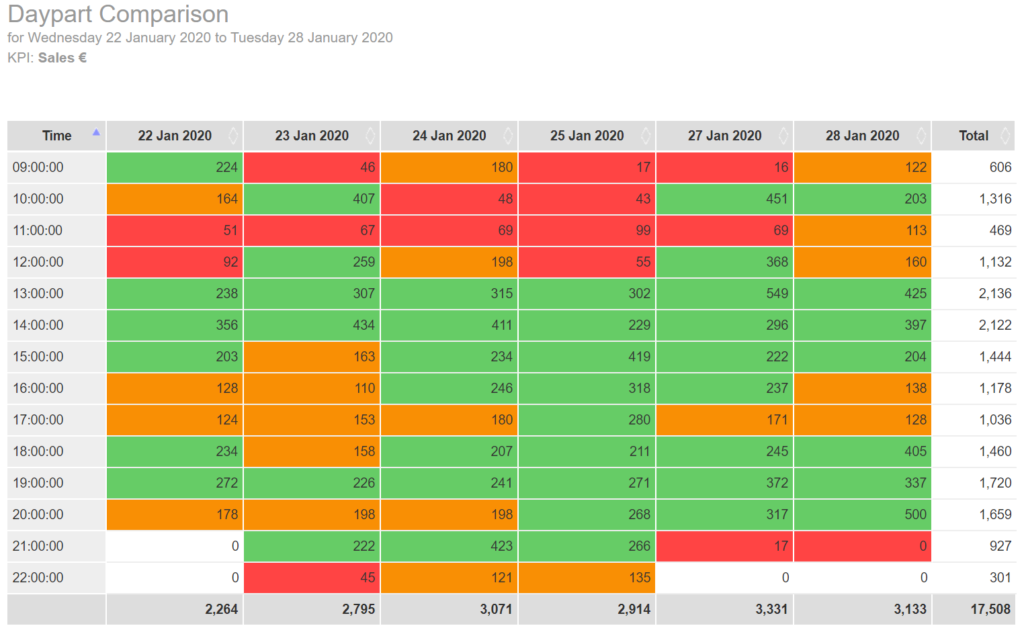
● Bar charts with drill down to allow you to layer data and drill into the detail. As an example below, if you wanted to understand more about your sales on Saturday, you could click on this row and it would split this out into the products sold on that day or even totals by part of the day e.g. Morning, Lunchtime or Evening shifts.
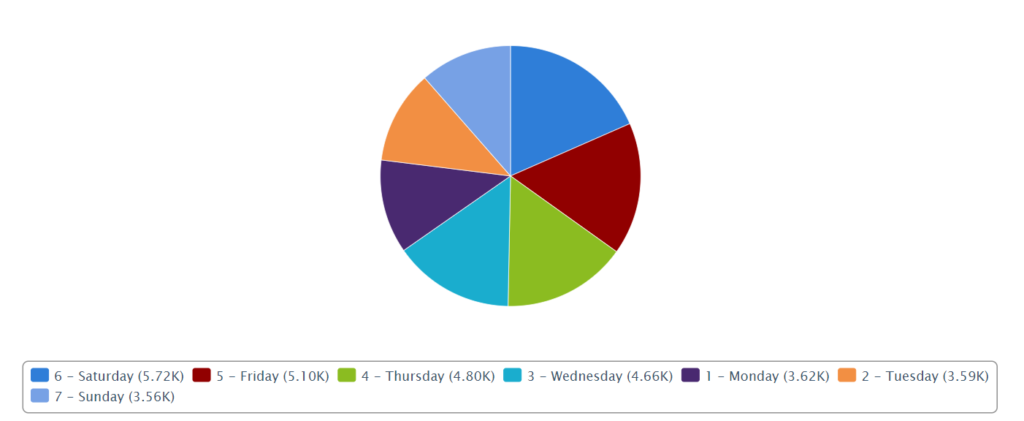
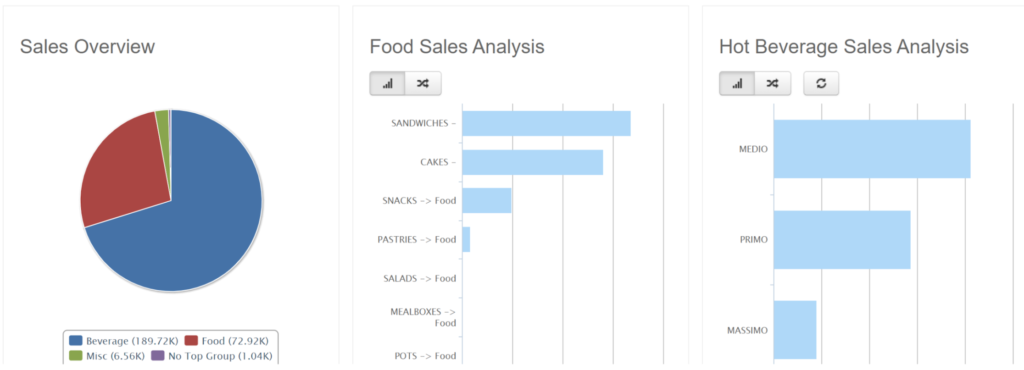
● Pie Charts to graphically understand the constituent parts of a total. Or;
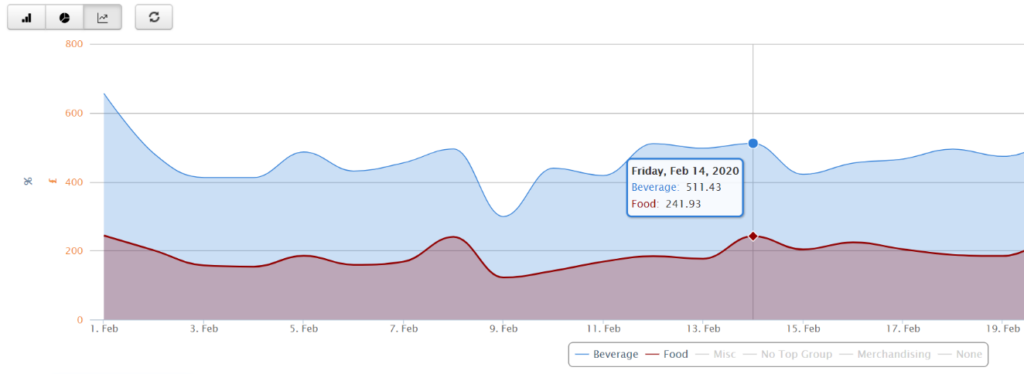
● Line graphs so you can see trends over time
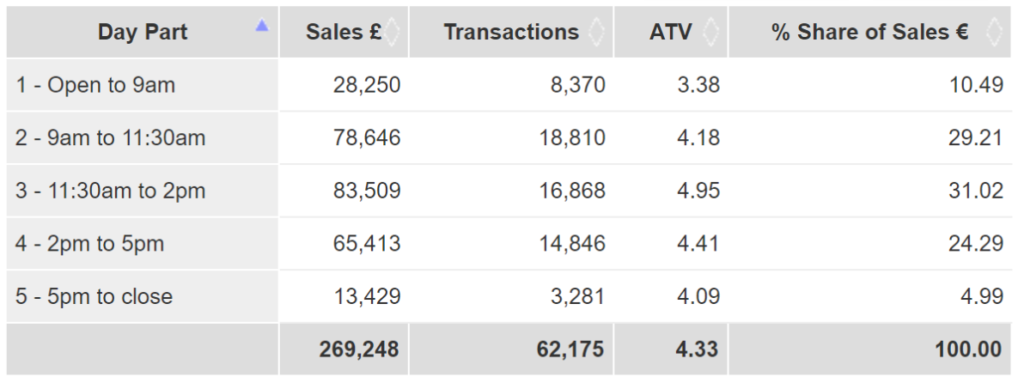
Within Operational Reports, you can also have bespoke tables with coloured identifiers to show data analyst performance metrics against budgets or prior year totals. These can simply report totals by a desired metric, or we can include mathematical formulae to replicate any calculations you might make in Excel. These tend to be the key reports because whilst graphical items are useful at the end of every review, a business owner will always want the “the result”.
All these items can be tailored to your needs with any relevant drill down, filters or pivots so you can easily navigate and adjust reports to see what you would like.
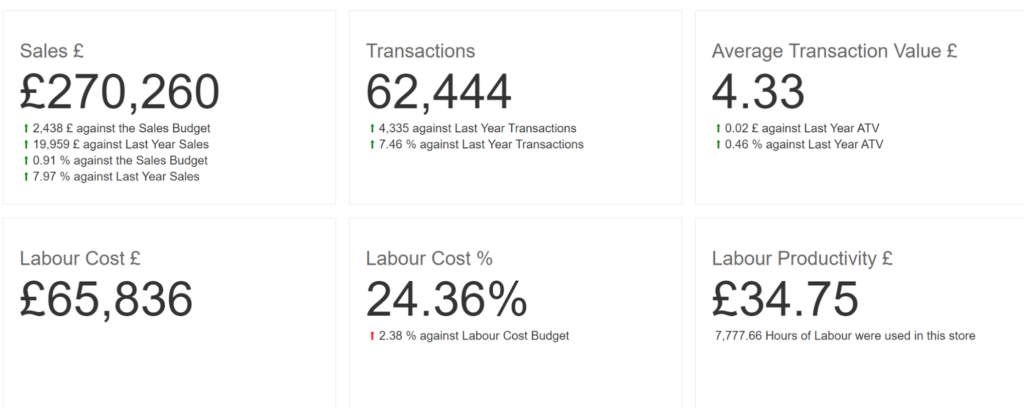
2. Dashboards:
All operational reports/tables can be condensed or transferred to financial dashboards where you can view certain snapshots of useful information that will run automatically based on a defined time/date period. For example, you can view information for this month, last month, last 2 weeks, or any other required time period. Additionally, any numerical data can be displayed as headline tiles with various comparators so that key information is instantly available.
3. Reconciliations:
As all tables can be configured to your needs, we also have the ability to produce reconciliations between 2 sets of information or reports. An example of this may be reconciling Purchase Orders against invoices or delivery notes, a sales transaction report against a tender report or simply credit card transactions against receipts. Any items that finance personnel spend large amounts of time reconciling, we can automate to enable your staff to focus on looking at and solving any differences.
4. Financial Statements:
Tables and graphs are all well and good for minds that work this way. But when all is said and done, it’s good old financial statements that get filed and will give you your final result. We can pull this data from various accounting systems and show totals by company or department. We can also aggregate companies or business units together or produce benchmarking reports so you can compare them and do KPI analysis.
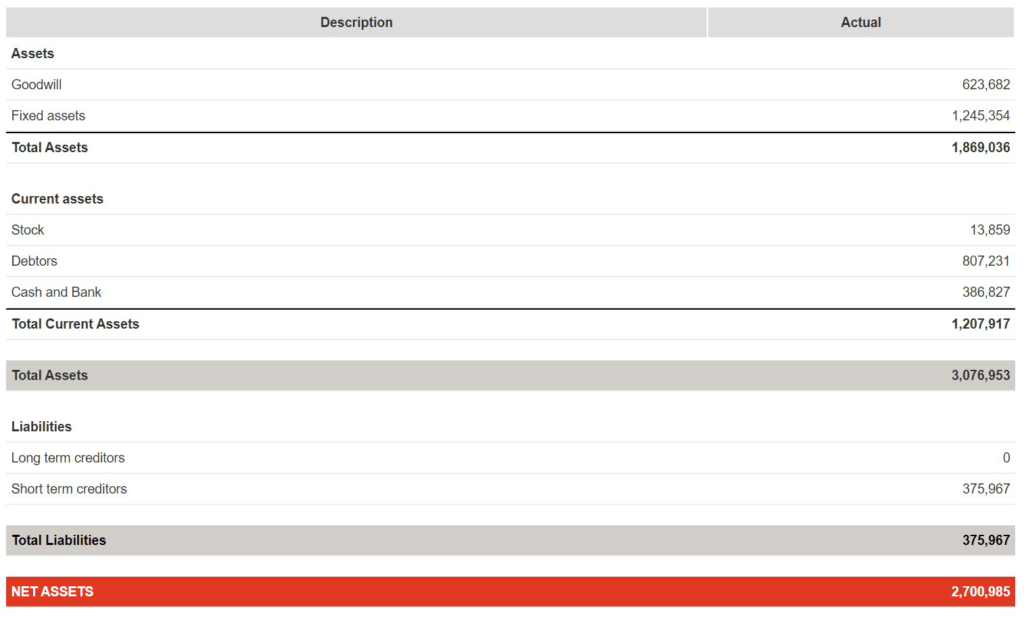
All financial reports have various views, allowing you to see performance for a whole year, by quarters, or even specific periods. As we work with period-based accounting systems, we can present a financial report based on calendar months, 4-4-5 weeks, or 13, 4-week periods. We offer a full range of financial statements, such as profit and loss, forecast profit and loss, balance sheet, and cash flow statement, with comparisons to budget and prior year/period. Furthermore, you can get Custom Financial Reports where you can define your own reporting format/structure or multiple structures. All reports are also deployed specifically to each user, ensuring complete security.
Whatever you want, we can deliver it.
If you would like to know more please don’t hesitate to contact us at www.4pointzero.co.uk.
Frequently Asked Questions (FAQ)
Why is KPI monitoring and reporting important for businesses?
KPI monitoring and reporting are crucial for businesses as they provide a clear understanding of their performance against set goals. It helps in identifying areas that need improvement, tracking progress over time, making data-driven decisions, and ensuring alignment with strategic objectives.
How can effective KPI monitoring enhance decision-making?
Effective KPI monitoring provides real-time insights into a business’s performance, enabling informed decision-making. By analyzing trends and patterns, organizations can identify areas of concern or success, allocate resources efficiently, and adjust strategies as needed.
What are the key components of a successful KPI monitoring and reporting strategy?
A successful KPI monitoring and reporting strategy comprise defining clear KPIs, selecting relevant data sources, establishing data collection methods, implementing analytics tools, setting benchmarks, analyzing data, and presenting findings through comprehensive reports.
How can businesses ensure the accuracy of their KPI data?
To ensure KPI data accuracy, businesses should implement data validation processes, regularly audit data sources, eliminate duplicate or irrelevant data, train employees on data entry protocols, and invest in data quality management tools.
What are some best practices for implementing a KPI monitoring and reporting system?
To ensure the effectiveness of a KPI monitoring and reporting system, organizations must prioritize alignment between KPIs and overarching goals. Additionally, selecting reliable data sources and maintaining data security contribute to the credibility of the system. Regular reporting and encouraging a data-focused culture enhance the impact of the process.